Topic: Debugger Integration
I've been rather quiet on the subject since pointing out that it was in the works, but the debugger integration with Simply Fortran is functionally complete. With a component of this magnitude being added, some significant testing still remains. However, on the face of it, everything is working as it should. I've attached a few screenshots below:

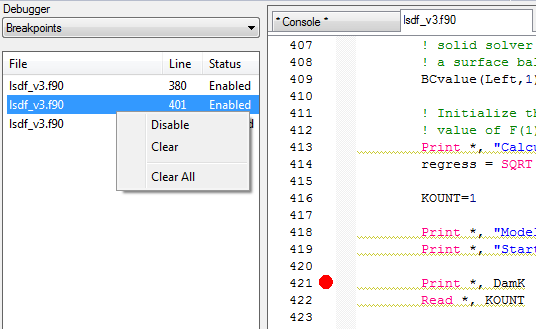
Breakpoints can be set within the editor, and a list of current breakpoints is always available. Clicking in the margins of a source file allows setting and clearing breakpoints.

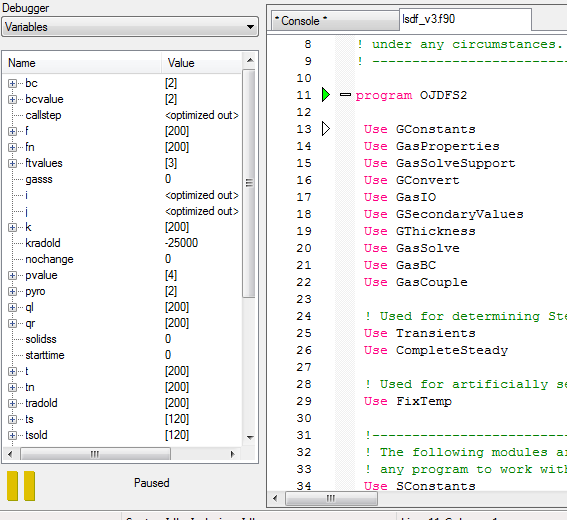
All local variables can be observed at any time. Arrays, like in most debuggers, must be expanded to see their components. Similarly, you can expand derived types to see their components as well.

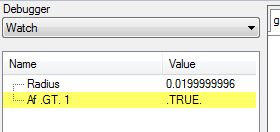
Variables (global or local) and expressions can be added to a watch list, either by entering the text manually or selecting text and using the editor's right-click menu. In the example, you can see I've checked if a variable is greater than 1. Any time a variable or watch expression changes, the entries are highlighted in yellow.

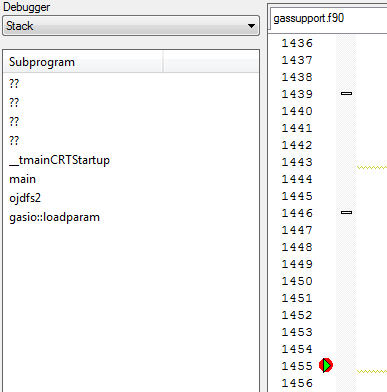
The call stack is also available. Double-clicking on any point in the call stack allows you to navigate to the point and view the local variables in the specified frame, as one would expect.
Right now everything is working, but there's plenty more tests to run! If you have any initial comments, please leave them here. This integrated debugger will completely replace Insight, so please be ready to say goodbye to Simply Fortran's current debugger shortly.
Approximatrix, LLC